Eingangsunsicherheiten & Risikoprofile
Bei der Modellierung neuer und innovativer Produktionsszenarien sind viele Entscheidungen noch unklar, und vieles ist noch unbekannt. LineLab akzeptiert diese Unsicherheit und ermöglicht es den Benutzern, sie vollständig in die Modelle zu integrieren – indem sie die Auswirkungen auf endgültige Ergebnisse präzise quantifiziert. LineLab befähigt die Benutzer, Unsicherheiten miteinzubeziehen, wertvolle Erkenntnisse auch mit begrenzten Informationen zu erhalten, zu priorisieren und Risiken effektiv zu managen.
Agiler Ansatz
LineLab unterstützt einen iterativen Ansatz, bei dem die Eingaben zu Beginn mit minimalen und maximalen Werten und optional einem wahrscheinlichen Wert angesetzt werden können, um die verfügbaren Informationen in diesem Stadium genau zu erfassen. Mit zunehmend verfügbaren Daten können die Eingaben schrittweise verfeinert werden. Einige Eingangsunsicherheiten haben einen größeren Einfluss als andere – LineLab vermittelt ein klares Bild davon, wie jede Eingabe und ihre Unsicherheit die Ergebnisse beeinflusst und hilft so dabei, diejenigen Eingaben zu priorisieren, die relevant sind.
Quantifizierung des Risikos jeder Eingabe
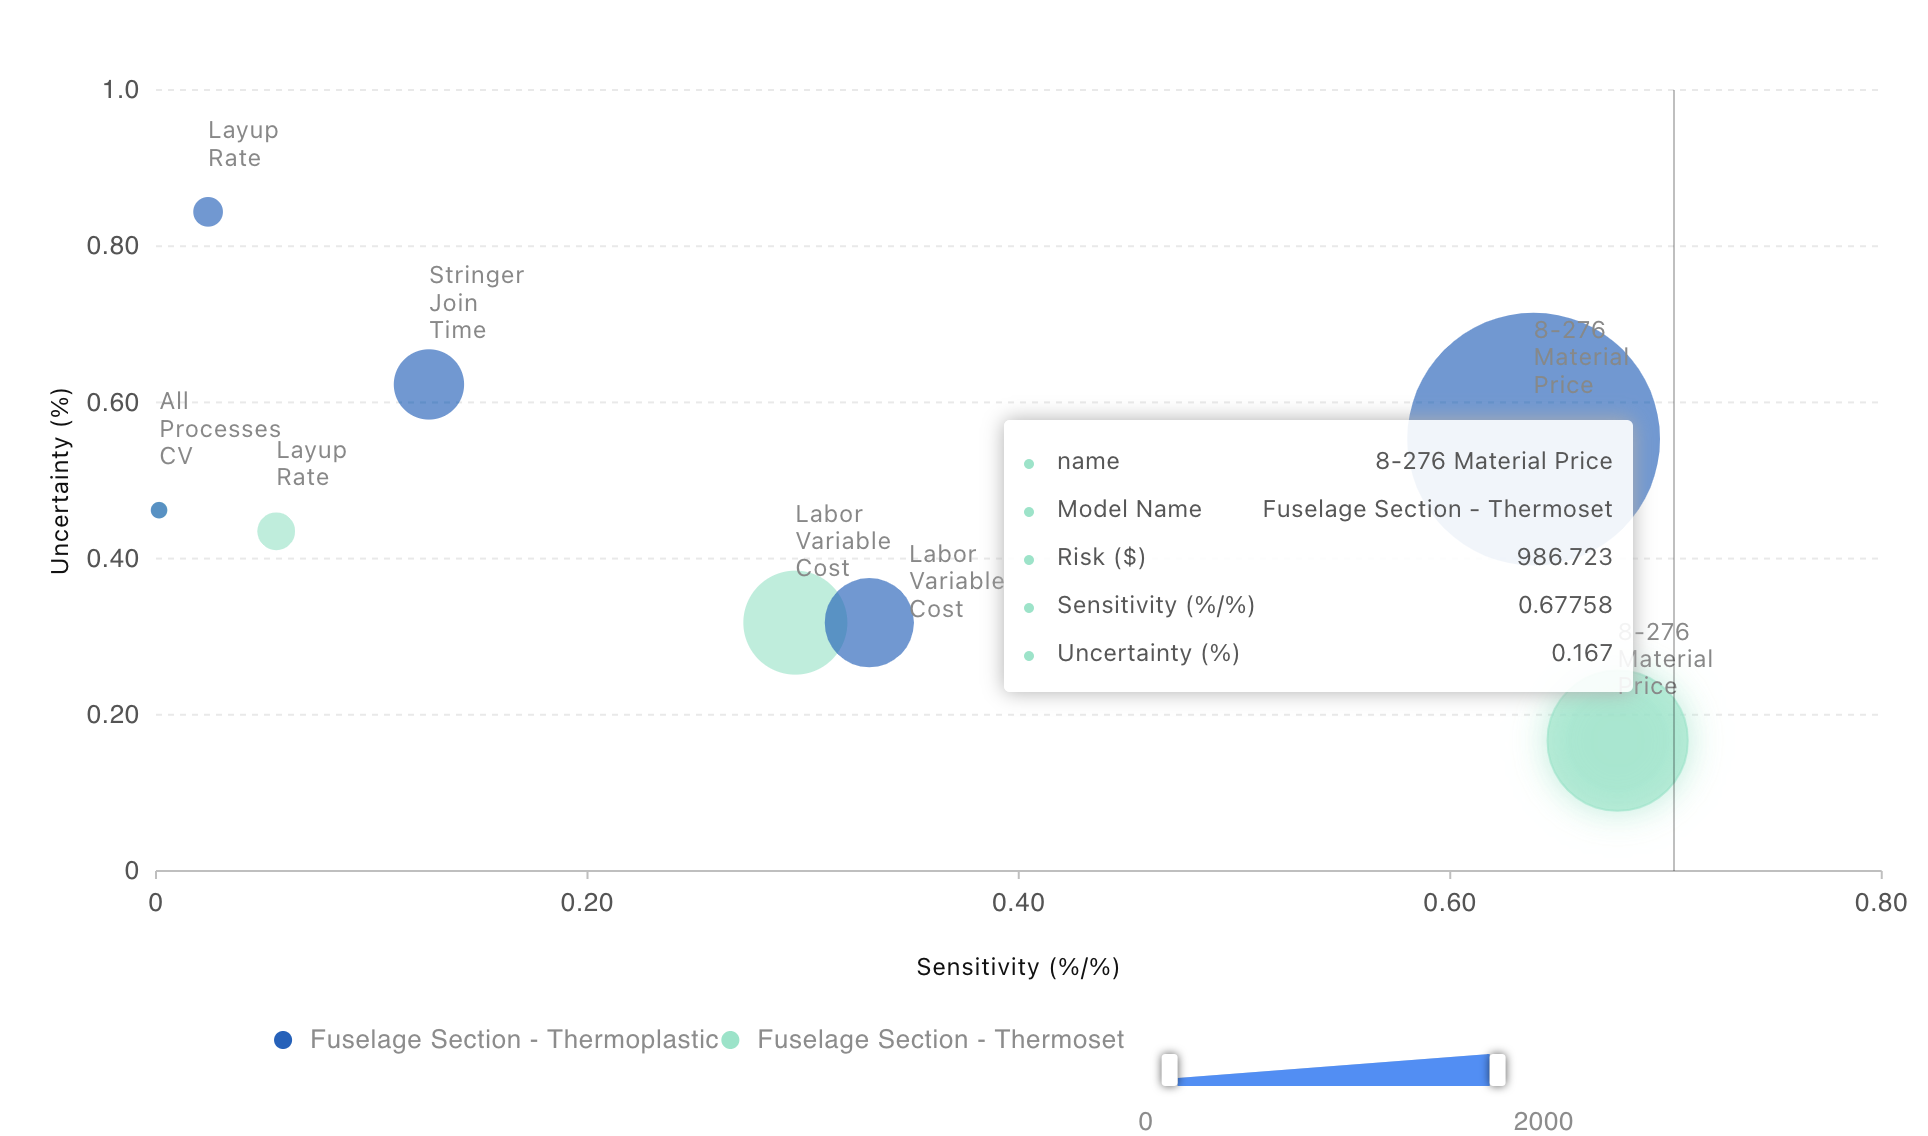
Wenn eine Eingabe mit Unsicherheit spezifiziert wurde, kann LineLab die daraus resultierende Sensitivität nutzen, d.h. wie stark die Eingabe letztendlich die Gesamtkosteneinheit beeinflusst, um das monetäre Risiko (in Euro, USD, GBP, usw.) zu berechnen, das die Unsicherheit dieser Eingabe für die durchschnittlichen Gesamtkosteneinheiten darstellt. Um diese Informationen zu visualisieren, erstellt LineLab automatisch ein interaktives Bubble-Chart. Jede der Blasen repräsentiert eine andere Eingabe. Die Größe der Blase entspricht dem monetären Risiko für die Gesamtkosten.
Sowohl Sensitivitäten als auch Unsicherheiten sind einzigartige Merkmale von LineLab, und diese Risikoperspektive wird häufig verwendet, wenn Technologien auf ihre Risiken hin überprüft werden und um einen iterativen Ansatz zu verfolgen: frühzeitig mit Unsicherheiten beginnen und gezielt in den wesentlichen Bereichen Details hinzufügen, wobei die Risiken und Sensitivitäten als Rückmeldung dienen. LineLab führt diese Analyse automatisch bei jeder Neuberechnung durch, welche unsichere Eingaben beinhaltet. Die Modellergebnisse können dann verwendet werden, um Risikoprofile von Prozess- oder Konstruktionsalternativen zu vergleichen.
Vergleich von Risikoprofilen der Gesamtkosten
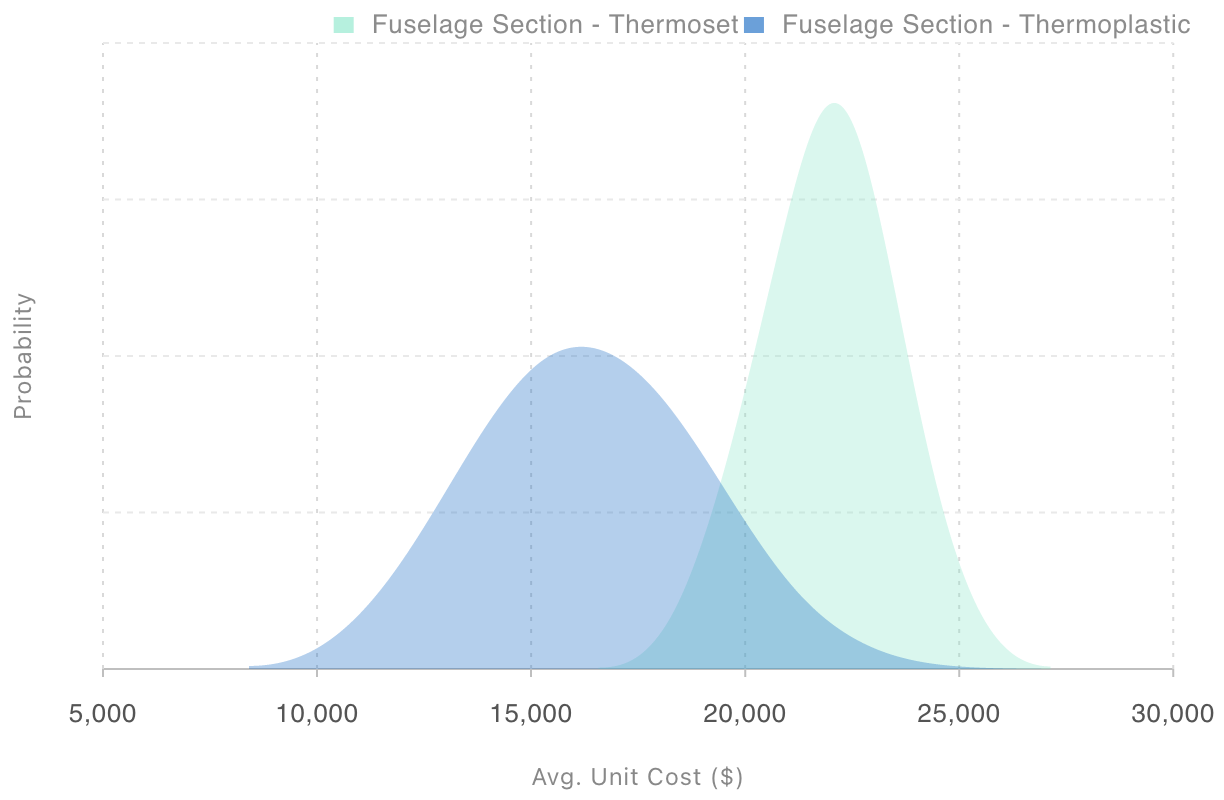
Diagramme der Wahrscheinlichkeitsverteilung der Stückkosten bieten ein differenziertes und umfassendes Bild der voraussichtlichen erwarteten Kosten auf der Grundlage unsicherer Eingaben. Durch den Vergleich von Risikoprofilen für Technologien unterschiedlicher Reifegrade gewinnen Entscheidungsträger wertvolle Erkenntnisse über die potenziellen Ergebnisse, die mit jeder Option verbunden sind. Die Diagramme der Wahrscheinlichkeit der Gesamtkosten ermöglichen ein gründliches Verständnis der involvierten Unsicherheiten und ermöglichen es Unternehmen, informierte Entscheidungen zu treffen, die mit ihren strategischen Zielen übereinstimmen. Mit den Diagrammen der Wahrscheinlichkeit der Gesamtkosten können Benutzer potenzielle Ergebnisse bewerten und die Verteilung der Kosten aufgrund der erfassten Unsicherheiten verstehen. Diese Informationen erleichtern eine zuversichtliche Entscheidungsfindung, auch in Situationen, in denen genaue Daten rar sind.
Durch die Quantifizierung von Risiken und die Bereitstellung von Einblicken durch die Diagramme der Wahrscheinlichkeit der Gesamtkosten ermöglicht LineLab fundierte Entscheidungen. Benutzer können Eingaben mit höheren Risiken identifizieren und Ressourcen entsprechend zuordnen, um sicherzustellen, dass die Bemühungen dort konzentriert werden, wo sie den größten Einfluss haben. LineLab ermöglicht Unternehmen eine deutlich verbesserte Entscheidungsgrundlage, was zu einer verbesserten betrieblichen Effizienz und verbessertem Risikomanagement führt.
Effektives Risikomanagement und Transparenz
Die Funktion der Eingangsunsicherheit von LineLab ist ein leistungsstarkes Werkzeug für ein effektives Risikomanagement. Durch die Bewertung von Unsicherheiten, die Quantifizierung von Risiken und die Bereitstellung transparenter Erkenntnisse ermöglicht LineLab Entscheidungsträgern, Risiken proaktiv zu managen. Die interaktiven Diagramme bieten Transparenz, wodurch diverse Interessengruppen die Ergebnisse verstehen und darauf aufbauen können. Diese Transparenz fördert informierte Diskussionen, stimmt Interessengruppen ab und gewährleistet, dass Risikomanagementstrategien effektiv umgesetzt werden.
Indem es Unsicherheiten akzeptiert und leistungsstarke Funktionen bietet, befähigt LineLab Benutzer, komplexe Herausforderungen zu bewältigen, wertvolle Erkenntnisse mit begrenzten Informationen zu gewinnen, Ressourcenzuweisungen zu priorisieren, Transparenz sicherzustellen und Risiken effektiv zu managen.